Quick Start
Welcome to the quick start guide for sumnplot.
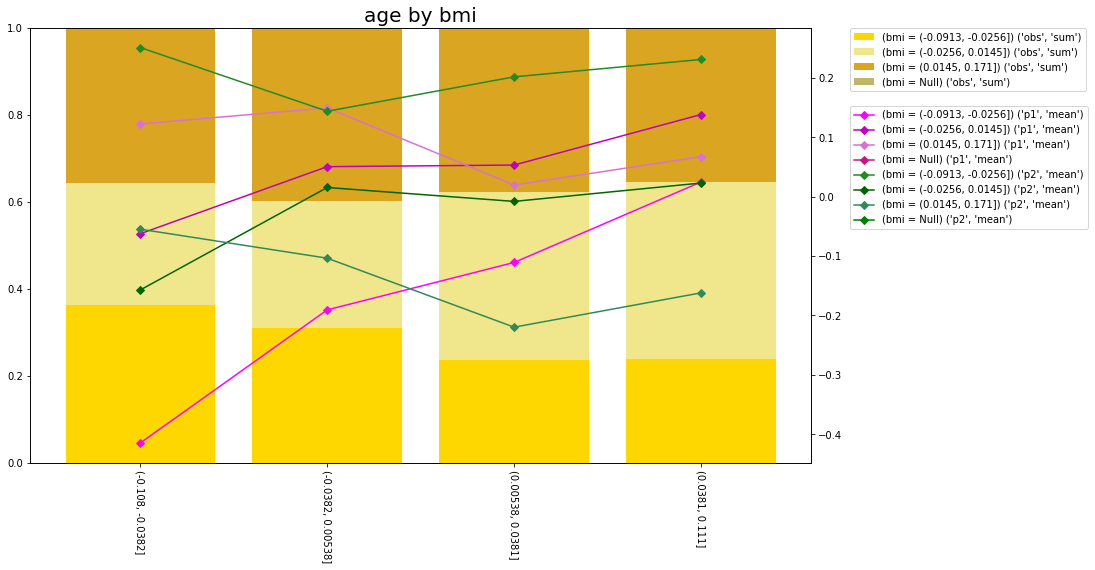
sumnplot provides functionality to produce summary plots like below. The code to produce this plot can be found at the bottom of this page.
Installation
The easiest way to get sumnplot is to install directly from pip;
pip install sumnplot
Discretisation
sumnplot.discretisation provides some simple ways to discretise numeric variables including by equal width, equal weight or quantile buckets.
Summarisation
sumnplot.summary provides a way to summarise multiple columnswith the ColumnSummariser class. This will sum columns by other columns and can discretise columns using the discretisation module,
Plotting
sumnplot.plot.matplotlib provides to functions to plot one or two way summary data.
The code to produce the plot at the top of this page is below;
from sklearn.datasets import load_diabetes
from sumnplot.discretisation import QuantileDiscretiser
from sumnplot.summary import ColumnSummariser
from sumnplot.plot.matplotlib import plot_summarised_variable_2way

X, y = load_diabetes(return_X_y=True, as_frame=True)
X["s1"] = X["s1"] - X["s1"].min()

two_way_summary = ColumnSummariser._summarise_column(
    df=X,
    to_summarise_columns=["s1", "s2", "s3"],
    to_summarise_columns_labels=["obs", "p1", "p2"],
    to_summarise_divide_column="s1",
    by_column=QuantileDiscretiser(
        variable="age", quantiles=(0, 0.25, 0.5, 0.75, 1.0)
    ),
    second_by_column=QuantileDiscretiser(
        variable="bmi", quantiles=(0, 0.33, 0.66, 1.0)
    ),
)

plot_summarised_variable_2way(
    two_way_summary,
    axis_right=0,
    axis_left=[1, 2],
    bar_type="stacked",
    bars_percent=True,
)